
Proportional representation vs first past the post concerns how votes become seats. First past the post selects a winner in each single-seat district. Proportional representation aims to make seat shares reflect vote shares across a constituency that returns multiple representatives, though its precise rules vary.
The contrast becomes clear when a narrow lead repeats across several districts. Winning each local contest can produce all the seats without anything close to all the votes. A pooled allocation can produce a different result from those same totals. Neither calculation, on its own, predicts how an actual electorate would behave under a changed system.
Proportional representation vs first past the post: the setup
Imagine five fictional districts, each returning one representative and recording exactly 100 valid votes. In every district, candidate A receives 52 votes and candidate B receives 48. For this exercise, the candidates belong to their respective A and B parties. There are no other candidates, invalid ballots or ties.
The equality assumed here is the number of valid votes and the number of seats per district. We do not infer equal populations, equal turnout rates or identical communities. The numbers are chosen to make the arithmetic visible, not to describe a real election.
Under first past the post, A wins each district because 52 is greater than 48. Adding those five victories gives A five seats and B none. Across all districts, A receives 260 votes and B receives 240, or 52 percent and 48 percent of the 500 votes.
| District | A votes | B votes | District winner |
|---|---|---|---|
| 1 | 52 | 48 | A |
| 2 | 52 | 48 | A |
| 3 | 52 | 48 | A |
| 4 | 52 | 48 | A |
| 5 | 52 | 48 | A |
| Total | 260 | 240 | A wins all five seats |
The result is not an arithmetic mistake. Each district chooses one winner separately. B's votes do not earn a seat by being added together afterward under this rule. Their geographic distribution matters because the seat contests happen district by district.
Pooling the same votes into five list seats
Now replace the five single-seat contests with one five-seat list constituency. Assume the same 260 votes go to list A and the same 240 go to list B. This deliberately holds preferences and ballots constant while changing the allocation unit and rule. Both lists are eligible, with enough candidates to fill their allocated seats.
For this version, use a Hare quota with largest remainders. Divide the 500 valid votes by five seats: the quota is 100 votes per seat. Dividing each list's votes by that quota gives 2.6 for A and 2.4 for B.
First allocate the whole-number portions: two seats to A and two to B. That assigns four of the five seats. A has a remainder of 0.6 of a quota, equivalent to 60 votes; B has 0.4, equivalent to 40. The remaining seat goes to A, whose remainder is larger.
| List | Votes | Share of votes | Quota calculation | Initial seats | Remainder | Final seats |
|---|---|---|---|---|---|---|
| A | 260 | 52% | 260 ÷ 100 = 2.6 | 2 | 0.6 | 3 |
| B | 240 | 48% | 240 ÷ 100 = 2.4 | 2 | 0.4 | 2 |
A therefore receives three seats and B two. The seat shares are 60 percent and 40 percent, not exactly 52 percent and 48 percent. With only five indivisible seats, each seat represents a fifth of the chamber. A proportional aim does not make fractional representatives possible.
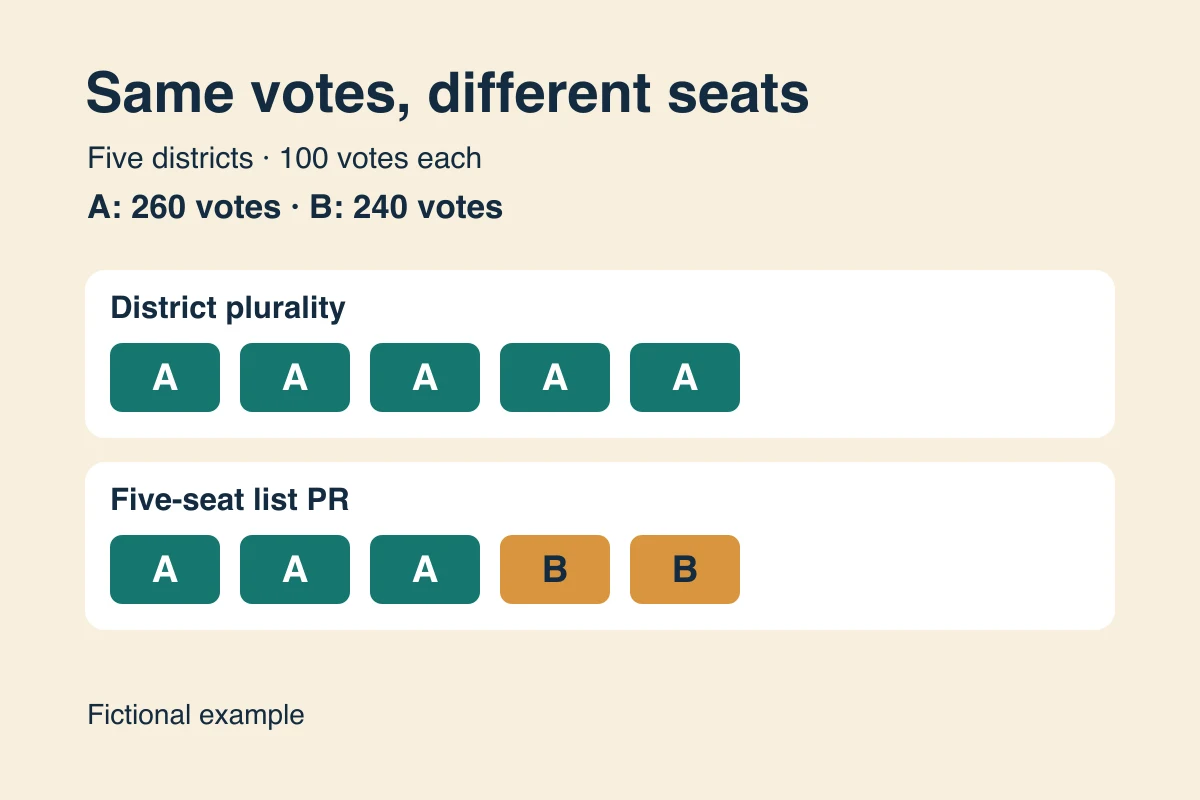
The chart presents invented arithmetic under the stated rules. The cover is a conceptual illustration. Neither image is an election forecast, a survey or a description of an existing country's result.
What the example demonstrates and what it holds fixed
The worked comparison demonstrates that identical aggregate votes can translate differently when the allocation rule and constituency structure change. It does not show that every close election produces a sweep. If B's support were concentrated differently across districts, its district victories could change even with the same overall vote total.
It also does not model strategic voting, candidate appeal, turnout, party entry or campaigning. Voters might make different choices when selecting an individual district representative rather than a party list. Parties might nominate different candidates. Holding those incentives and responses outside the calculation is an explicit simplification, not a claim that they are unimportant.
International IDEA's Electoral System Design handbook distinguishes electoral families and discusses how design choices affect representation. Its treatment includes list proportional representation and largest remainder allocation using a Hare quota. This article uses those concepts for a small, independently specified exercise.
The IDEA electoral systems database also distinguishes candidate contests in single-member districts from party lists in multi-member districts. That difference explains why our second calculation requires a new ballot assumption, rather than pretending the original district ballots are automatically transferable under any real law.
Different questions about representation
Seat proportionality is one question. The relationship between a representative and a geographic district is another. A single-seat district identifies one local winner, while the list example distributes several seats across the pooled constituency. Evaluating either arrangement requires deciding which aspects of representation matter to the comparison.
Details inside a system matter too. A list system's threshold can affect which lists qualify; constituency size affects the granularity of seat allocation; and different formulas may produce different outcomes. Open and closed lists also provide different ways of determining which candidates fill a party's seats. None of those variations is resolved by the label alone.
Nor does an allocation formula establish how well elected representatives will perform. Accountability, rights, legislative procedures and the quality of information available to voters require separate consideration. The fictional totals provide no evidence about corruption, governing competence or future policy.
Connecting electoral preferences to the twelve axes
The twelve axes overview separates several questions about politics and government. Preferences about representation can sit alongside views about economic policy, individual freedom and where authority belongs. Favoring a particular electoral formula does not determine all those other positions.
The methodology explains how responses become the site's scores. It does not turn our fictional seat calculation into a country ranking or a measurement of democratic quality. No ideological coordinates are assigned to A, B or their voters here.
To explore your wider preferences, take the 12 Axes test. Keep the calculation and the evaluation distinct: first identify the votes, constituencies and allocation rule, then consider the kind of representation you want that arrangement to provide.