
Gerrymandering vs redistricting distinguishes an activity from a claim about how it is used. Redistricting revises electoral district boundaries. Gerrymandering describes drawing those boundaries to advantage a group or party. A new map is therefore not automatically evidence of manipulation, while familiar or simple shapes do not establish neutrality.
The National Conference of State Legislatures glossary distinguishes redistricting from an intentionally advantageous district plan. It also explains terms such as contiguity, packing and cracking. These concepts help describe a map, but applying them to an actual dispute requires evidence about the relevant setting.
Gerrymandering vs redistricting in a small grid
Consider an invented five-by-five grid. Each cell represents exactly one vote, marked A or B. There are 25 votes altogether: 15 for A and ten for B. Five single-seat districts must be formed, with five cells in each. The district winner is whichever letter has more votes within its boundary.
The rows, from top to bottom, are AAABB, AABAB, AABBA, AAABB and AABAB. No vote moves between cells when we compare the plans. The only change is whether each district contains a horizontal row or a vertical column.
| Row | Column 1 | Column 2 | Column 3 | Column 4 | Column 5 |
|---|---|---|---|---|---|
| 1 | A | A | A | B | B |
| 2 | A | A | B | A | B |
| 3 | A | A | B | B | A |
| 4 | A | A | A | B | B |
| 5 | A | A | B | A | B |
Both plans create five districts of five cells. Each district is connected along shared cell edges. These are equal-sized, contiguous districts within the model. That does not establish compliance with real-world population standards: a cell is a vote here, not a census record or a neighborhood with known residents.
There are no ties because each district has five votes divided between two choices. There are also no turnout changes, additional candidates or altered voter preferences. These simplifications let us isolate grouping rather than model an election campaign.
Horizontal districts produce five A seats
Take each row as a district. Every row contains three A votes and two B votes. A wins each of the five contests by three to two, so the resulting seat allocation is A five and B zero.
Across the whole grid, A still has 60% of the votes and B 40%. The seat shares are 100% and zero because the system awards a seat for each local victory. It does not allocate five seats proportionally from the pooled 25-vote total.
This is why gerrymandering vs redistricting cannot be understood solely by counting votes across the entire map. Where a group's supporters are located and how district boundaries group them together affect local victories. The aggregate vote share does not contain that geographic information.
The horizontal calculation demonstrates a possible consequence of boundaries. It does not tell us why a person selected those boundaries. No mapmaking process or intention has been supplied for the fictional plan.
Vertical districts produce two A seats and three B seats
Now make each column a district. Columns one and two contain five A votes each. Columns three and four each contain two A votes and three B votes. Column five contains one A vote and four B votes.
A wins the first two columns, while B wins the other three. The result is A two seats and B three, even though the grid still contains 15 A votes and ten B votes. No one changed a vote; the grouping changed the winners.
| District number | A votes in horizontal district | Horizontal winner | A votes in vertical district | Vertical winner |
|---|---|---|---|---|
| 1 | 3 | A | 5 | A |
| 2 | 3 | A | 5 | A |
| 3 | 3 | A | 2 | B |
| 4 | 3 | A | 2 | B |
| 5 | 3 | A | 1 | B |
| Seats won | A: 5; B: 0 | Five A wins | A: 2; B: 3 | Two A wins |
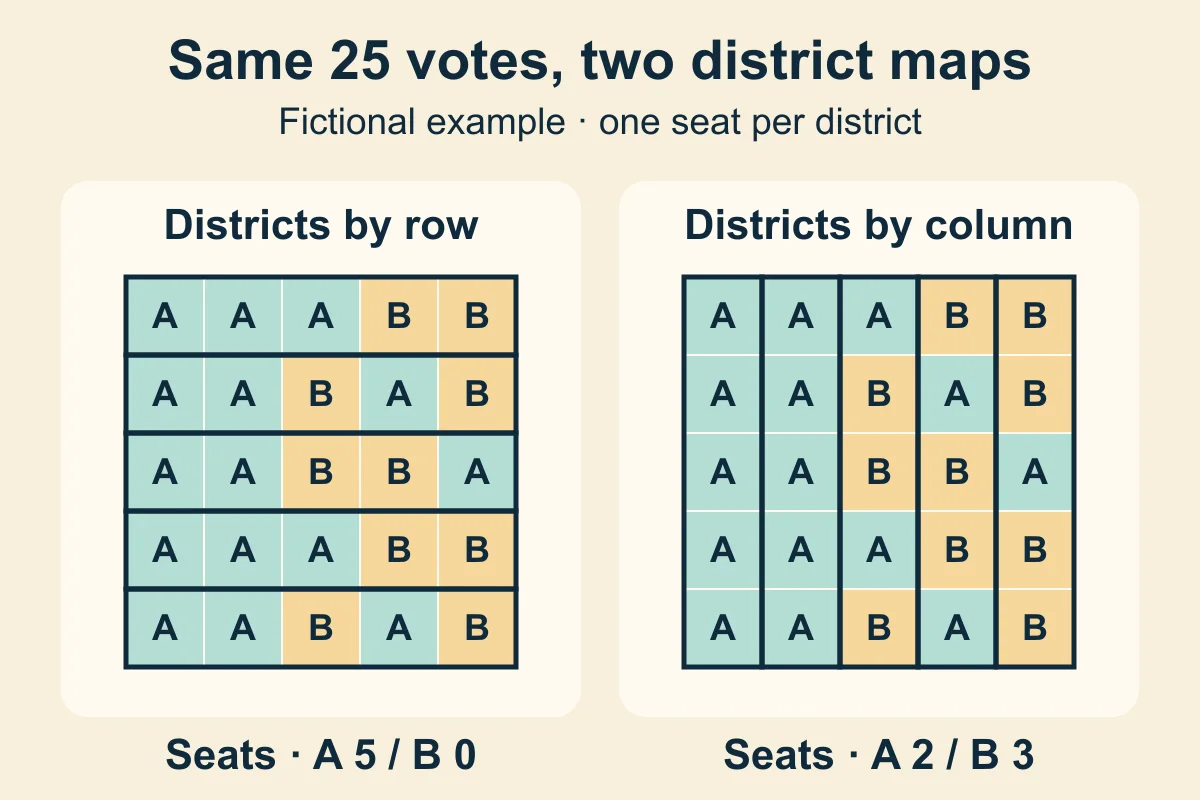
The diagram is fictional arithmetic, not a map of actual voters or evidence about a real district plan. The cover is a conceptual illustration. Neither the horizontal nor the vertical arrangement is presented as a fair baseline, a recommended reform or a legal conclusion.
Packing, cracking and the limits of the illustration
Packing describes concentrating a group in relatively few districts, while cracking describes dividing it in ways that reduce its influence. In the vertical arrangement, A's votes are heavily concentrated in two columns. In the horizontal arrangement, B loses every district despite making up two votes in each row.
Those patterns help explain how boundaries can affect representation. They do not, by themselves, identify a mapmaker's purpose. A responsible discussion of gerrymandering vs redistricting separates the observable distribution from a claim that someone deliberately engineered an advantage.
The grid contains no rivers, roads, municipal boundaries or communities of interest. It also omits the criteria a real mapmaker would have to consider and any records of how decisions were made. Without those facts, we cannot evaluate whether either plan respects relevant communities or was selected for an improper reason.
The same caution applies to shape. Both arrangements use simple rectangles, yet their results differ sharply. A visual impression cannot substitute for examining the process and the relevant criteria. Conversely, an irregular outline can have explanations that a bare picture does not reveal.
Gerrymandering vs redistricting: what evidence matters?
For an actual plan, useful questions include which criteria guided the work, what alternatives were considered and whether the explanation matches the choices made. Population information, geographic constraints and community evidence add context that our grid deliberately lacks.
Election results can contribute to an analysis, but a single seat outcome does not establish intent or settle every question about representation. Repeated patterns, alternative plans and the assumptions used to construct them require careful interpretation. This article offers no statistical test or legal standard for deciding a real dispute.
Our explanation of proportional representation and district plurality addresses a related distinction: allocating seats from pooled votes versus selecting separate district winners. Here, the winner rule stays fixed, while the boundaries change. Keeping those two comparisons separate makes the arithmetic easier to interpret.
Connect the example to broader political preferences
The twelve axes overview separates questions about representation from views on economics, personal freedom and where authority should sit. A preference about mapmaking procedures does not supply answers to all those other questions. A and B are simply labels in this example, with no ideological positions attached.
The methodology explains how the site's responses become scores. Those scores are not findings about a map's legality or the intentions of its author. The invented grid contains no country coordinates, measured public attitudes or claims about real parties.
To explore your wider views, take the 12 Axes test. When considering gerrymandering vs redistricting, distinguish what changed in the boundaries, what happened to district outcomes and what evidence supports an explanation of why the plan was chosen.