
An accurate political compass test would need evidence for what its scores mean, not just a label that sounds like you. Start by separating three questions: can its arithmetic be checked, do scores remain reasonably consistent under relevant conditions, and is the proposed interpretation supported? A quiz can pass the first check while leaving the other two unanswered.
For 12 Axes, the scoring is available and can be reproduced. The site has not validated its scales as a scientific instrument. This guide shows how to inspect one result and keep that boundary visible. It does not rank competing tools or certify this one. The cover is a conceptual illustration of checking a copy against its source, not a research result.
What an accurate political compass test would need
“Accurate” is incomplete until you name the claim. Summarizing how you answered a set of statements is a narrower purpose than identifying your permanent ideology. Predicting a vote is another purpose again. Evidence that supports one interpretation would not automatically support the others. Decide which question you want answered before treating a polished report as evidence.
ETS's introduction to validation connects validity to the evidence supporting proposed score interpretations and uses. Applied here, that means asking what supports the political meaning assigned to a score. This is a general measurement principle, not an ETS assessment or endorsement of political quizzes.
A result can still help you organize a conversation. You might notice that you favor one economic arrangement but a different approach to personal freedom. That usefulness is an observation about the discussion it prompts. It does not supply a tested prediction or establish how precisely the numbers describe a wider political outlook.
Reproducible arithmetic
The first check is concrete. Given the same questions, answers and scoring rules, can the calculation be followed? The 12 Axes methodology explains the response weights and normalization. Each answered statement contributes to its axis; the contribution reverses sign when the statement favors the opposite pole. The final percentage is rounded.
This lets you inspect a particular result without guessing what a colored chart hides. It also makes mistakes easier to discuss: a disagreement about the rule is different from a mistake applying it. Neither issue is resolved by liking the final label. Transparency makes a calculation open to inspection; it cannot establish that the chosen questions measure everything their axis name suggests.
When searching for an accurate political compass test, look for this distinction in the explanation. “You can reproduce our output” is a claim about the program. “Our output identifies your outlook” needs additional support. A longer formula or an extra decimal place cannot bridge that gap on its own.
One changed answer
Here is an invented calculation using the site's actual scoring function. It is not a participant study, a set of real test attempts, or a confidence interval. Imagine one axis containing 3, 5 or 24 answered statements. All favor the first pole for this teaching example. One answer is strongly agree, with weight 2; every other answer is neutral, with weight 0.
Change only that first answer to agree, with weight 1. The signed total falls from 2 to 1. Each answered item contributes 2 to the possible maximum. The score therefore follows 50 + 50 × signed total ÷ maximum, rounded to an integer. Holding every other condition fixed produces the three comparisons below.
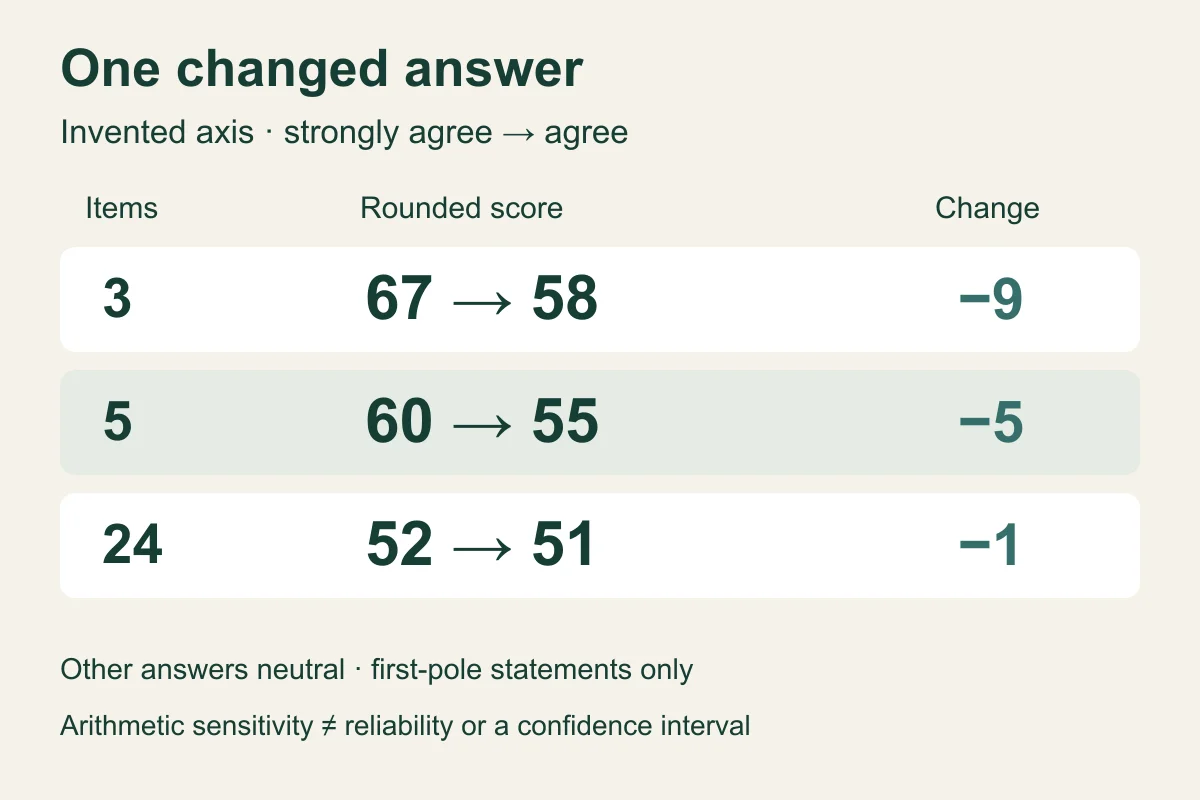
Worked example, not observed data. The three item counts match the per-axis counts of the quick, standard and full modes, but these invented responses and item directions are not complete sessions from those modes.
With 3 items the rounded score changes from 67 to 58. With 5 it changes from 60 to 55. With 24 it changes from 52 to 51. This establishes one limited arithmetic fact: a fixed contribution change has less influence when the denominator is larger. It does not establish that the longer mode is a more accurate political compass test.
Notice another limit of the comparison. Different modes select different material, so their actual results need not differ only because of length. In the calculation above, the extra neutral answers also pull the starting score toward 50. Do not interpret the smaller difference as a measured reduction in uncertainty, or as proof that the longer answer set is closer to a true political position.
Consistency needs a fair comparison
ETS's guide to reliability describes score consistency across relevant occasions, editions or raters. Recalculating one fixed answer file is a different exercise. A program can be perfectly deterministic even when people interpret its statements differently on different days.
For a personal comparison, keep a brief record of the language, mode, date and reasons for uncertain answers. The quick and standard modes sample statements; the full mode uses the full bank, with shuffled order. If you switch mode and language while revising several answers, you have changed multiple conditions. A score difference cannot reveal which one caused it.
You also might have learned something or changed your mind. That is not automatically a scoring failure. Conversely, identical labels do not prove that the underlying answers stayed identical. Treat your own repeat attempt as a prompt for inspection, not a reliability study with a reported coefficient. A useful accurate political compass test explanation should make these limits easy to find.
Scores, labels and reference profiles
A percentage here describes a balance of weighted responses. It is not the percentage of citizens who agree with you, a probability of belonging to a movement, or a measure of how morally consistent you are. The axis guide explains what each pair of poles is intended to summarize. Read the dimensions that interest you before accepting a broad identity label.
The ideology comparison adds another layer: the site compares four selected dimensions with reference ideology profiles. Countries and historical figures are compared separately on twelve axes. The reference positions are editorial estimates or sketches, not survey measurements. A close profile is therefore a close profile within this model, not outside confirmation of your identity.
This matters when two labels feel equally plausible. Inspect the differences the model actually uses and read the accompanying descriptions. Do not read a closeness percentage as scientific confidence. Searching for an accurate political compass test should lead to clearer claims about these comparisons, rather than bigger promises based on familiar names.
A short evidence record
Keep a small note that separates what you checked from what remains unknown. You do not need to publish your answers or personal information. The following record is a practical reading aid, not a certification system. Filling every row does not turn the result into a validated measurement.
| Claim | What you can inspect | What remains unproven |
|---|---|---|
| The score follows a rule | Weights, normalization, rounding | Whether the rule captures your outlook |
| One answer has limited influence | A fixed arithmetic example | Reliability in a population |
| A label summarizes your answers | Dimensions and reference profiles | A permanent political identity |
| Two attempts differ | Mode, language, answers and context | A single cause without further controls |
Write the purpose at the top: “I want a structured summary to discuss,” for example. Then note the calculation you can inspect and the interpretations you cannot substantiate. This is more useful than assigning your own accuracy rating from how flattering the description feels. An uncomfortable result can raise a worthwhile question; a comfortable one can still leave important views out.
Our alternative-test overview covers format choices. This article concerns the evidence behind a score, so its worked arithmetic is not a recommendation to select the longest option at any cost. Choose a mode you can answer attentively. If you want an accurate political compass test to settle every question about your beliefs, lower that expectation to something inspectable: take the test, examine the dimensions, and use the result to start a conversation you can explain in your own words.